Wenn Sie also für diese Tabelle die Druckoption anwenden, werden alle Daten gedruckt, die seit der Paginierung verfügbar sind, auch wie von Ihnen gewünscht.
DataTables ist ein Plug-in für die JavaScript-Bibliothek jQuery. Es ist ein äußerst flexibles Tool, das auf den Grundlagen der progressiven Erweiterung basiert und jeder HTML-Tabelle erweiterte Interaktionskontrollen hinzufügt.
Sie können Datatable nach Ihren Wünschen auf jede Tabelle anwenden.
Js, die auf Ihrer Seite hinzugefügt werden sollen:
$(document).ready(function(){
    $('#myTable').DataTable();
});
CSS:
<link rel="stylesheet" type="text/css" href="https://cdn.datatables.net/1.10.12/css/jquery.dataTables.min.css" />
JS:
<script src="https://cdn.datatables.net/1.10.12/js/jquery.dataTables.min.js"></script>
HTML-Tabelle:
<div id="printableArea">
<table id="myTable" class="display" width="100%" cellspacing="0">
            <thead>
                <tr>
                    <th>Name</th>
                    <th>Position</th>
                    <th>Office</th>
                    <th>Age</th>
                    <th>Start date</th>
                    <th>Salary</th>
                </tr>
            </thead>
            <tfoot>
                <tr>
                    <th>Name</th>
                    <th>Position</th>
                    <th>Office</th>
                    <th>Age</th>
                    <th>Start date</th>
                    <th>Salary</th>
                </tr>
            </tfoot>
            <tbody>
                <tr>
                    <td>Tiger Nixon</td>
                    <td>System Architect</td>
                    <td>Edinburgh</td>
                    <td>61</td>
                    <td>2011/04/25</td>
                    <td>$320,800</td>
                </tr>
                <tr>
                    <td>Garrett Winters</td>
                    <td>Accountant</td>
                    <td>Tokyo</td>
                    <td>63</td>
                    <td>2011/07/25</td>
                    <td>$170,750</td>
                </tr>
                <tr>
                    <td>Ashton Cox</td>
                    <td>Junior Technical Author</td>
                    <td>San Francisco</td>
                    <td>66</td>
                    <td>2009/01/12</td>
                    <td>$86,000</td>
                </tr>
                <tr>
                    <td>Cedric Kelly</td>
                    <td>Senior Javascript Developer</td>
                    <td>Edinburgh</td>
                    <td>22</td>
                    <td>2012/03/29</td>
                    <td>$433,060</td>
                </tr>
                <tr>
                    <td>Airi Satou</td>
                    <td>Accountant</td>
                    <td>Tokyo</td>
                    <td>33</td>
                    <td>2008/11/28</td>
                    <td>$162,700</td>
                </tr>
                <tr>
                    <td>Brielle Williamson</td>
                    <td>Integration Specialist</td>
                    <td>New York</td>
                    <td>61</td>
                    <td>2012/12/02</td>
                    <td>$372,000</td>
                </tr>
                <tr>
                    <td>Herrod Chandler</td>
                    <td>Sales Assistant</td>
                    <td>San Francisco</td>
                    <td>59</td>
                    <td>2012/08/06</td>
                    <td>$137,500</td>
                </tr>
    </table>
</div>
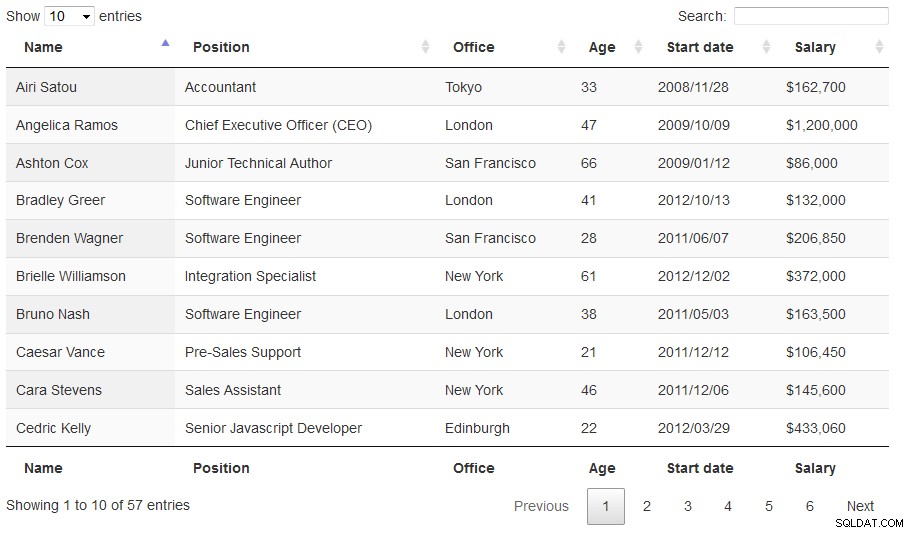
Wenn Sie also die Datentabelle für diese Tabelle anwenden, erhalten Sie eine Ausgabe wie diese.
Ausgabe: